VisMode Dashboard
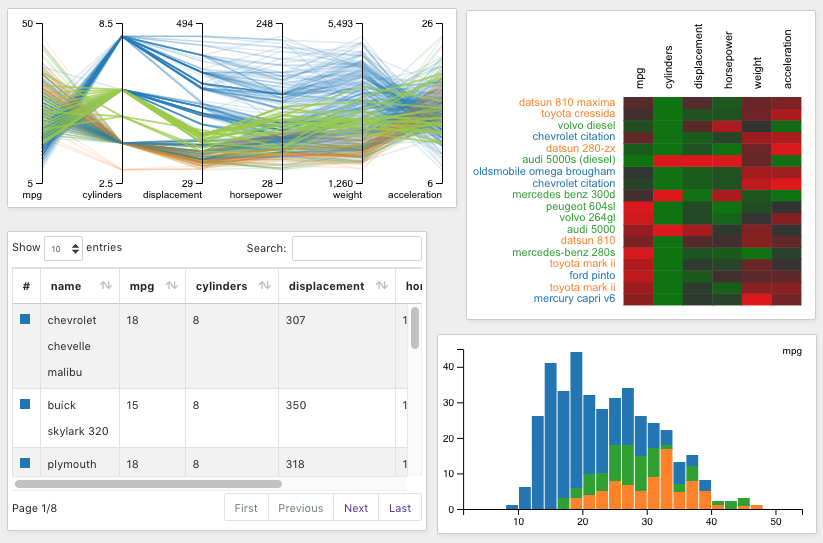
VisFlow features Visualization Mode (VisMode), in which only selected nodes (typically visualizations) are shown and the other diagram details are hidden, presenting a dashboard that can be useful for presentation or result sharing. The following figure shows the VisMode dashboard generated from the dataflow diagram in this example.
Press the VisMode switch button
at the top-right of the navbar to switch between diagram editing and VisMode dashboard.To configure which nodes are visible in the VisMode, click the VisMode toggle
in the option panel. By default, all visualizations are visible in the VisMode.