Line Chart
renders a line chart for series data. The input data must have a column that contains no duplicates as the series column. The line chart sorts the data items by their attribute values in the series column, and treats the data items as data points in the series. The values of the data points in the series are defined by the selected Value Column.If the input data contain multiple series, use the Group By Column> to group the data items and generate multiple lines.
Example
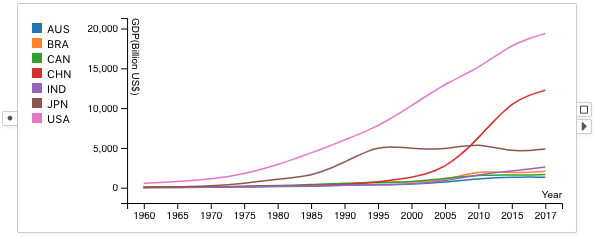
A series visualization showing the GDP of seven countries over the recent five decades. The input table contains series data as follows:
| Country Code | Year | GDP |
|---|---|---|
| USA | 1960 | 543.3 |
| USA | 1965 | 743.7 |
| USA | 1970 | 1075.884 |
| ... | ... | ... |
| CHN | 1960 | 59.7164676253 |
| CHN | 1965 | 70.4362661467 |
| CHN | 1970 | 92.6029734341 |
| ... | ... | ... |
In this case, the Series Column is Year. The Value Column is GDP The Group By Column is Country Code.
Selection
Selection in the line chart is performed over the series. Drag and draw a retangular box to select a series line that intersects the box. All data items that belong to the series are selected.
Visual Properties
| Type | Effect |
|---|---|
| color | Color of the line and data points on the line |
| border | Border color of the data points on the line |
| size | Diameter of the data points on the line |
| width | Width of the line and the data point border |
| opacity | Opacity of the line and the data points |
Options
Series Column
Configures which column to use as the series column. This column is visualized along the X-axis. Data items are sorted automatically by increasing values in this column. For each series, the values in the series column should not have duplicates, otherwise a warning will be displayed.
Value Column
Configures which column to use as the series values. This column is visualized on the Y-axis.
Group By Column
Applies grouping on the data points based on unique values in this column. After grouping, each group becomes one series line.
Draw Points
Shows the data points on the series lines. Points drawing is not supported when Draw Curve is on.
Draw Curve
Uses curve rendering for the series lines.
Legends
Displays legends for the rendered series lines. The legends are only applicable when a Group By Column is used.