 VisFlow
 Parallel Coordinates
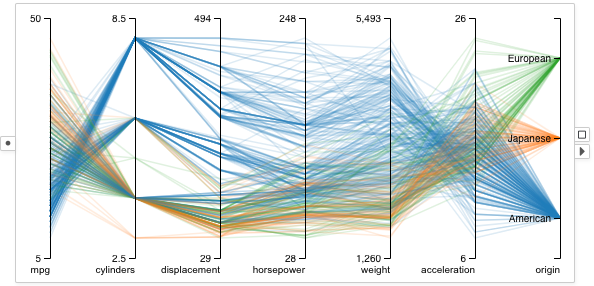
plot renders several columns together. Each column is represented using a vertical axis. Each data point is a polyline connecting to the axes. The location where a polyline intersects an axis correspond to the attribute value of the data item on that column.Example

A parallel coordinates plot showing seven columns from the cars table. The lines are color encoded by the origin countries of the cars.
Selection
Draw a stroke in the parallel coordinates to select data items of which the polylines intersect the stroke.
Visual Properties
| Type | Effect |
|---|---|
| color | Color of the polyline |
| border | Not supported |
| size | Not supported |
| width | Width of the polyline |
| opacity | Opacity of the polyline |
Options
Columns
Configures which columns to display in the parallel coordinates. The axes for the columns are shown from left to right.
Axis Margin
Uses 10% of margin on the top and bottom of all axes.
Use Dataset Range
Sets the domains of the axes to always equal to the value ranges of the entire dataset, rather than the value ranges of the subset received by the parallel coordinates.