Table
A Table
lists the attribute values of the data items in a table display. The Columns to be shown in the table can be adjusted using the option panel. The first column of the table shows the visual properties of the data.Example
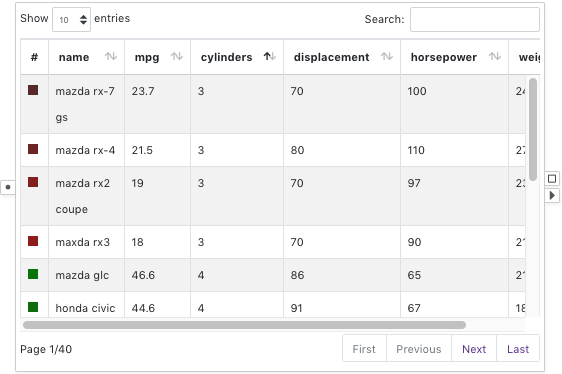
A table showing the car dataset: The first column shows the color visual properties of the cars. The colors are encoded by the mpg values of the cars using a red-green color scale.
Selection
Click the rows to select data items.
Visual Properties
| Type | Effect |
|---|---|
| color | Color of the box in the visual property column |
| border | Border color of the box in the visual property column |
| size | Not supported |
| width | Not supported |
| opacity | Not supported |
Options
Columns
Configures which columns to display in the table display. The columns are listed from left to right in the table display.